· Performance
- Conciseness
- Connectivity of information
- Materiality
- Strategic focus and future orientation
Key observations:
Tullow Oil presents a highly transparent and concise performance section which details how the company's key performance indicators are used to help measure strategic progress. Using the business model and strategy icon, each key performance indicator is clearly connected to the company strategy.
Interestingly, Tullow Oil key performance indicators have altered from the previous year and this is clearly acknowledged. The rationale for this – to create a stronger alignment between company performance and the company's strategy and to 'ensure appropriate measures were in place which reflect the Group's strategic priorities and business plans' – also provides the reader with a clear understanding for this change.
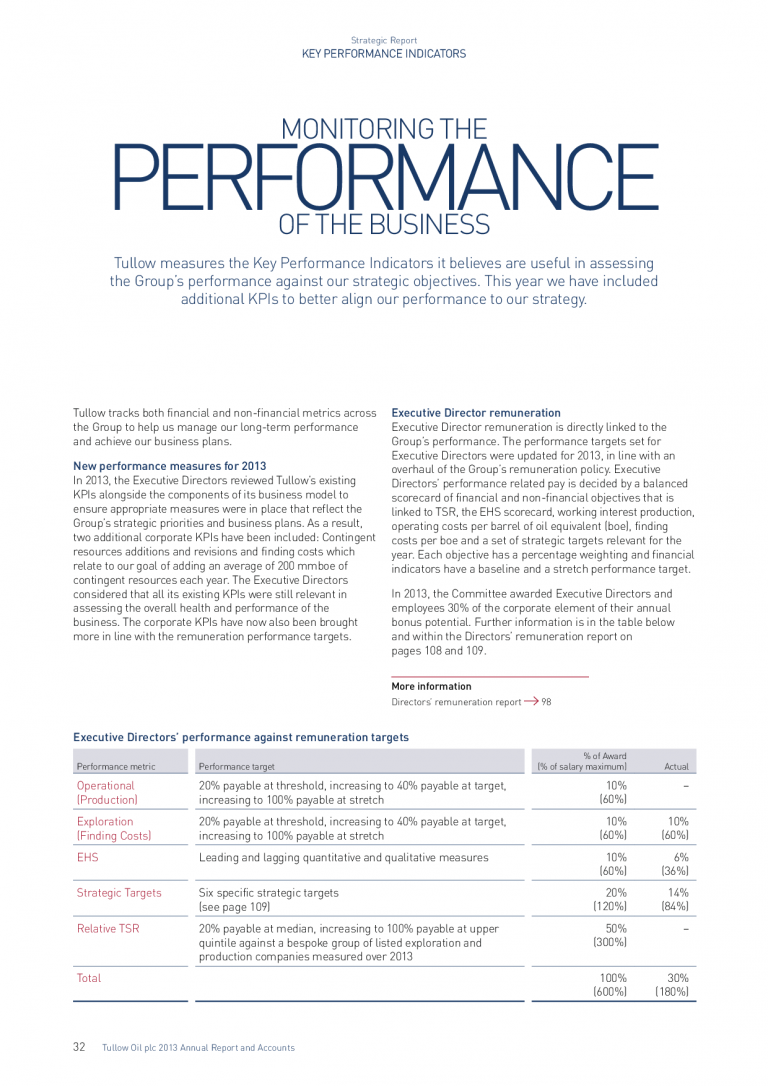
Another interesting initiative of Tullow Oil’s key performance indicators section is in the clarity and detail the business provides around the linkages between performance and Executive Director’s remuneration. Using a tabular format, Tullow Oil shows the direct link by identifying the key performance indicators used in executive remuneration, outlining the performance targets for each, the percentage of executive award allocated to each and the actual percentage awarded. This level of transparency is extremely effective in providing readers with an understanding not only of how the company performance impacts executive pay, but also in demonstrating that there is a high level of connectivity.
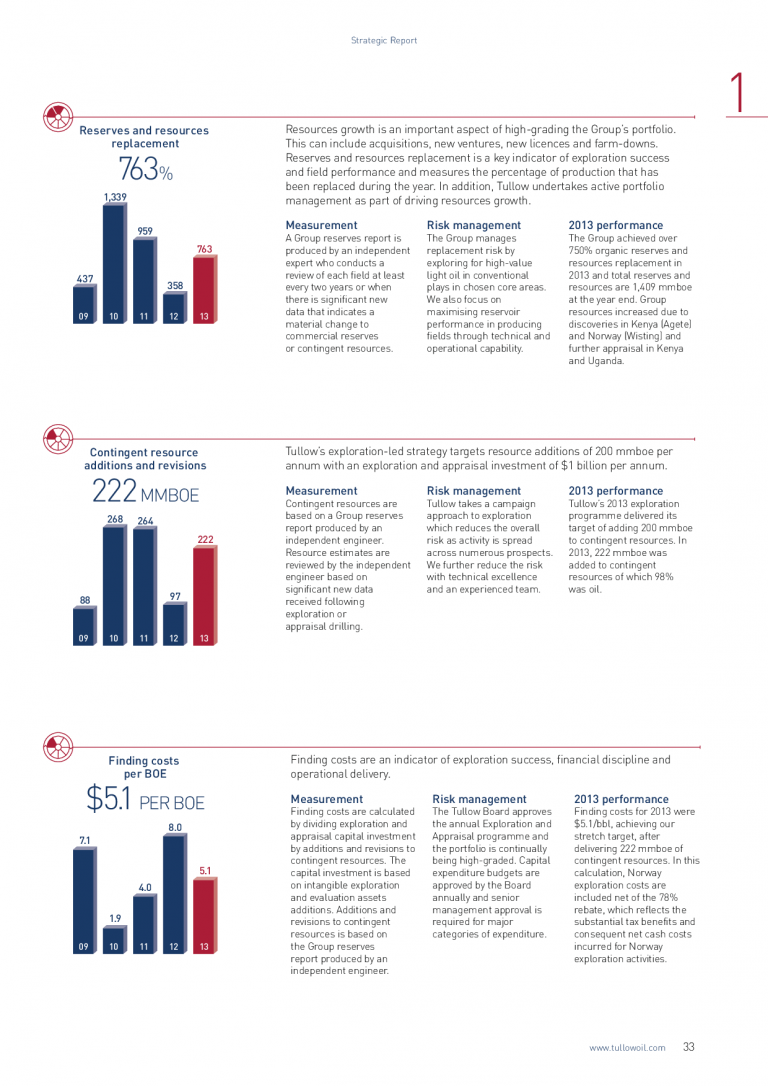
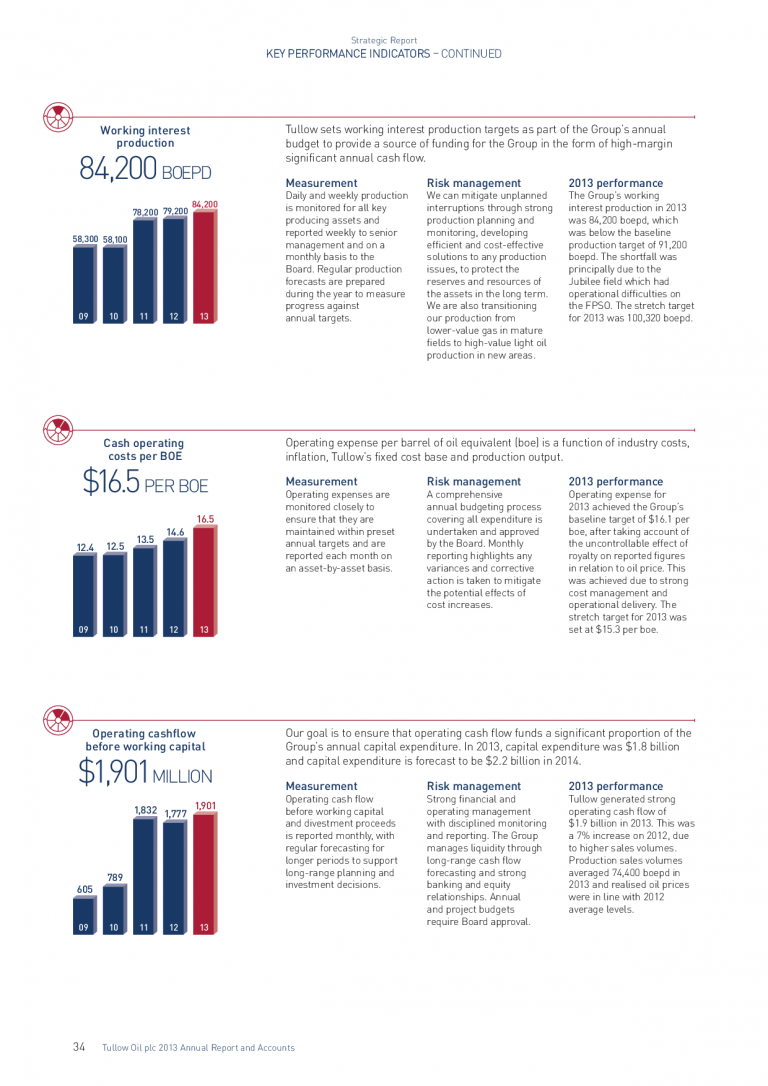
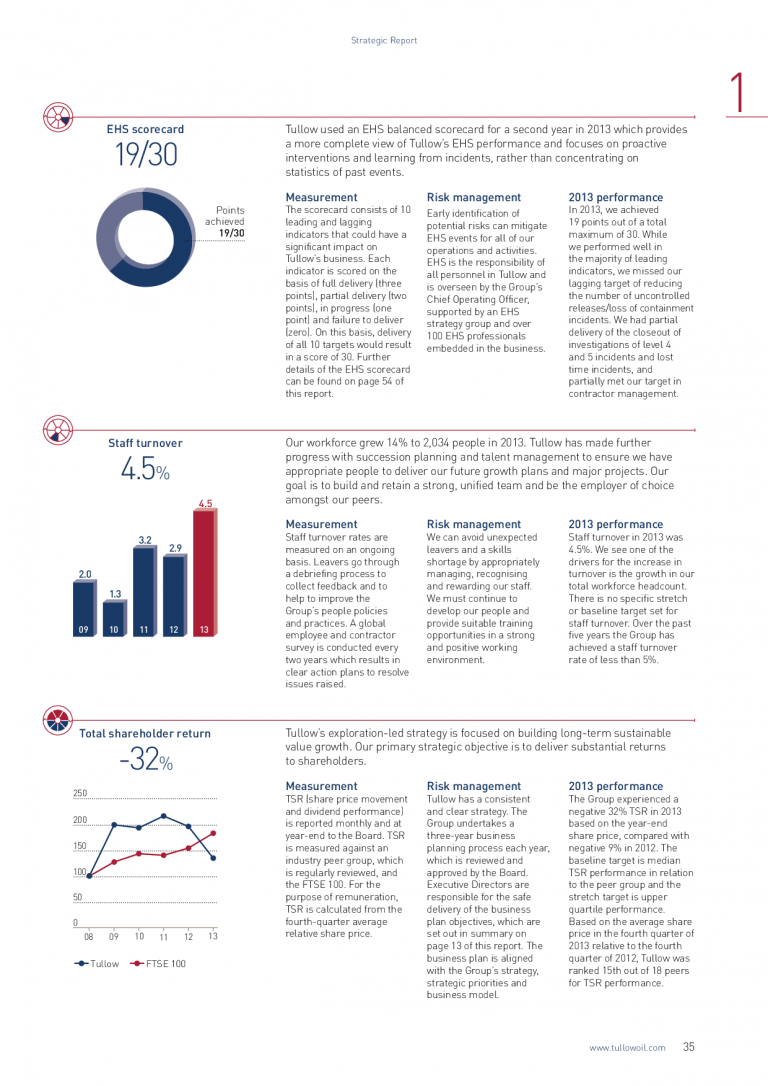
The key performance indicators are approached systematically, with clear descriptions, historical data to demonstrate progress, links to risk and an explanation of 2013 performance. All-in-all this provides a comprehensive review.