Standard Bank Group Ltd · Integrated Report 2019 · Business model
- Connectivity of information
Key observations:
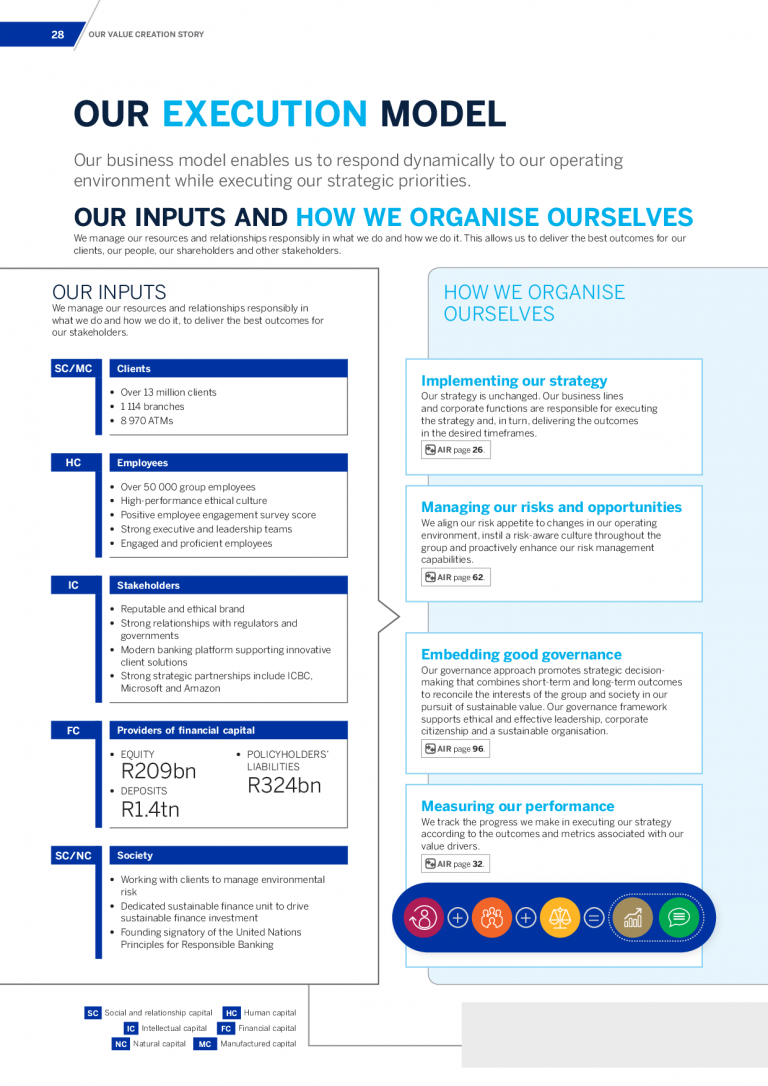
Standard Bank Group explains its business model over four pages, split into two diagrams, both covering double-page spreads. The first diagram is a business model overview and includes the following:
- A list of the company’s capital inputs into the business model (para. 4.14 of the International <IR> Framework).
- A short description of each strategy.
- Risk and opportunity management.
- Approach to governance.
- Performance measurement.
- A one-line overview of the external environment (all with page references to detailed explanation).
- A short description and an overview map of the company’s activities (para. 4.16 of the International <IR> Framework).
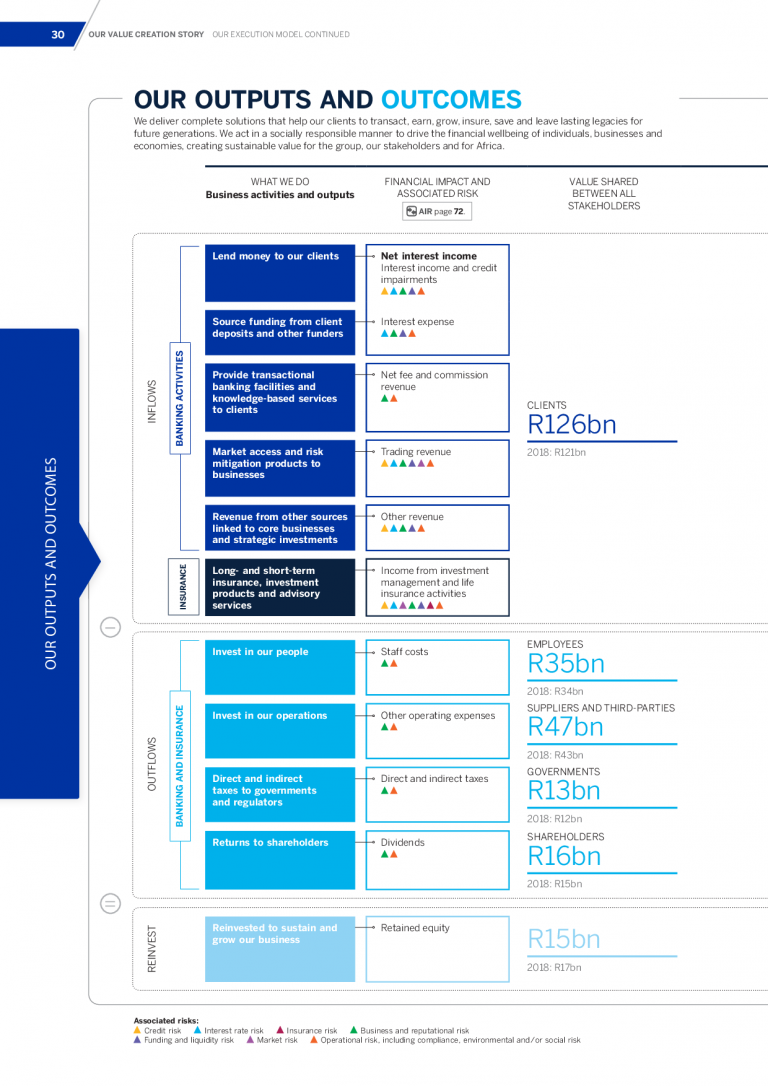
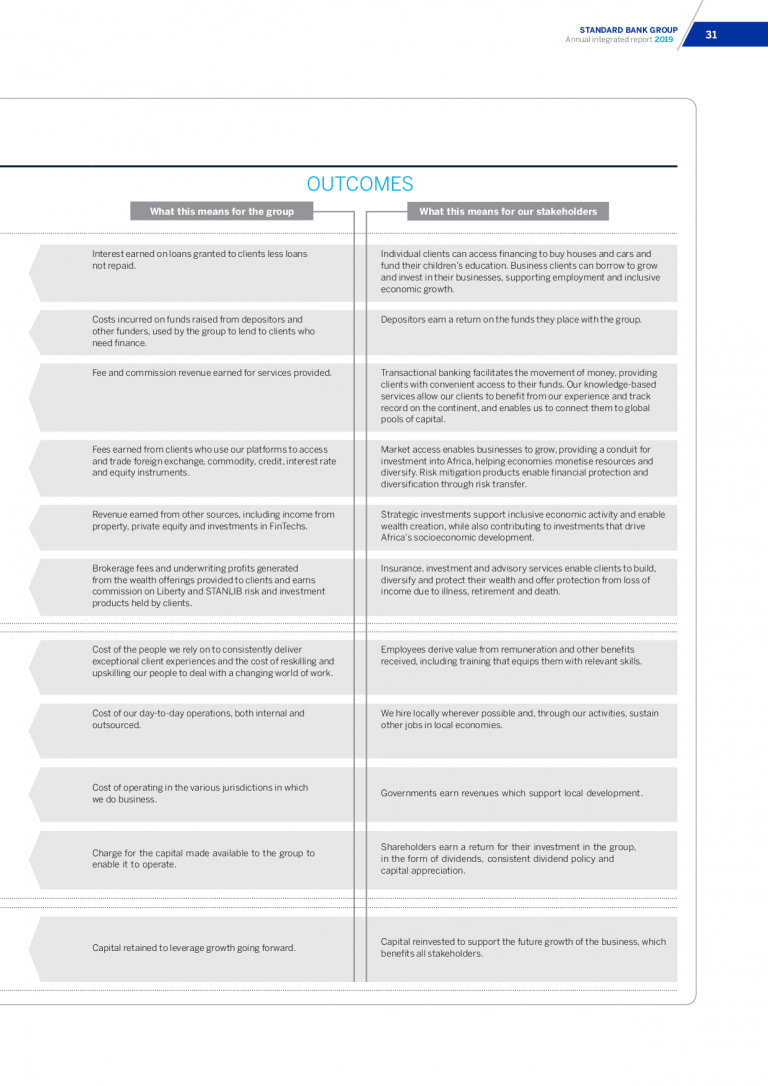
The second diagram outlines the business’s main outputs and outcomes, with the two aspects clearly delineated. Outputs are addressed under the heading ‘What we do’, whereby the report lists the company’s main business activities – thus outlining the business’s key products and services, as well as the by-products of the Group’s operations (para. 4.18 of the International <IR> Framework). For each output, the diagram then identifies outcomes split under two headings – ‘What this means for the group’, and ‘What this means for stakeholders’. The latter in particular explains the consequences of the Group’s activities for key stakeholders, with the stakeholders linked with relevant capitals in the ‘Our inputs’ section of the business model overview diagram on the previous page. In this way, the report explains the consequences for the capitals as a result of the company’s business activities and outputs (as per para. 4.19 of the international <IR> Framework).
Connectivity of Information (para. 3.6-3.9 of the international <IR> Framework) is also demonstrated throughout the two diagrams, with the page references in the first diagram to more detailed sections, as well as icons used to denote key stakeholder groups in the first diagram, and the key risks associated with each output in the second diagram.