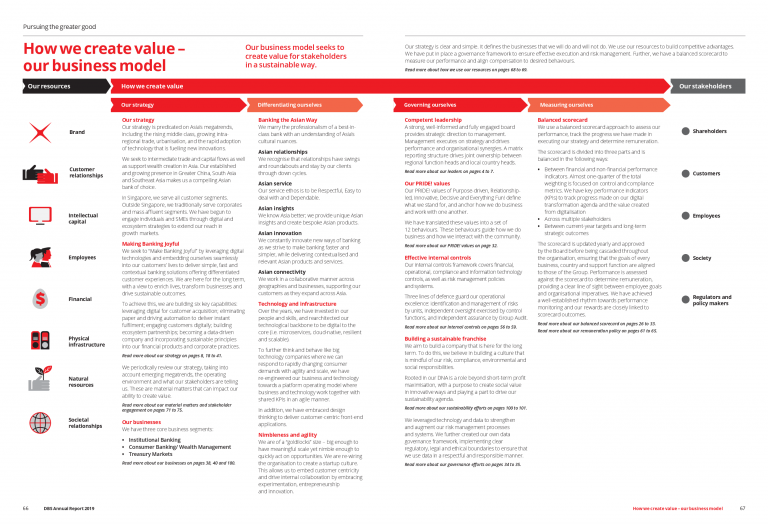
DBS · Annual Report 2019 · Business model
- The capitals
- Value creation
- Connectivity of information
- Stakeholder relationships
Key observations:
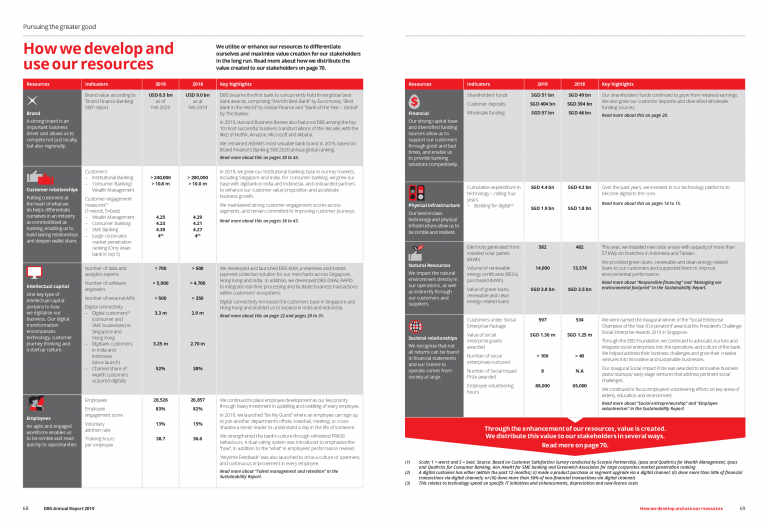
DBS's 2019 Annual Report provides an overview of how the bank creates value for its internal and external stakeholders (para. 2.4 of the International <IR> Framework). The business model diagram identifies the capitals that the business draws upon, and the double page spread that follows provides a narrative explanation of how the business uses each capital to execute its strategy and create value. For each capital, the double page spread also specifies business outputs (para. 4.18 of the International <IR> Framework), by providing the key indicators used to measure performance in each capital. The outputs are cross-referenced in the next page of the report, where DBS briefly explains the value provided to each of its key stakeholder groups, with page references to more detailed explanation.